511
#1
Analysts at research and advisory firm Gartner forecast that, by 2025, data stories (which are explained using visuals) will be the most common way of consuming analytics.
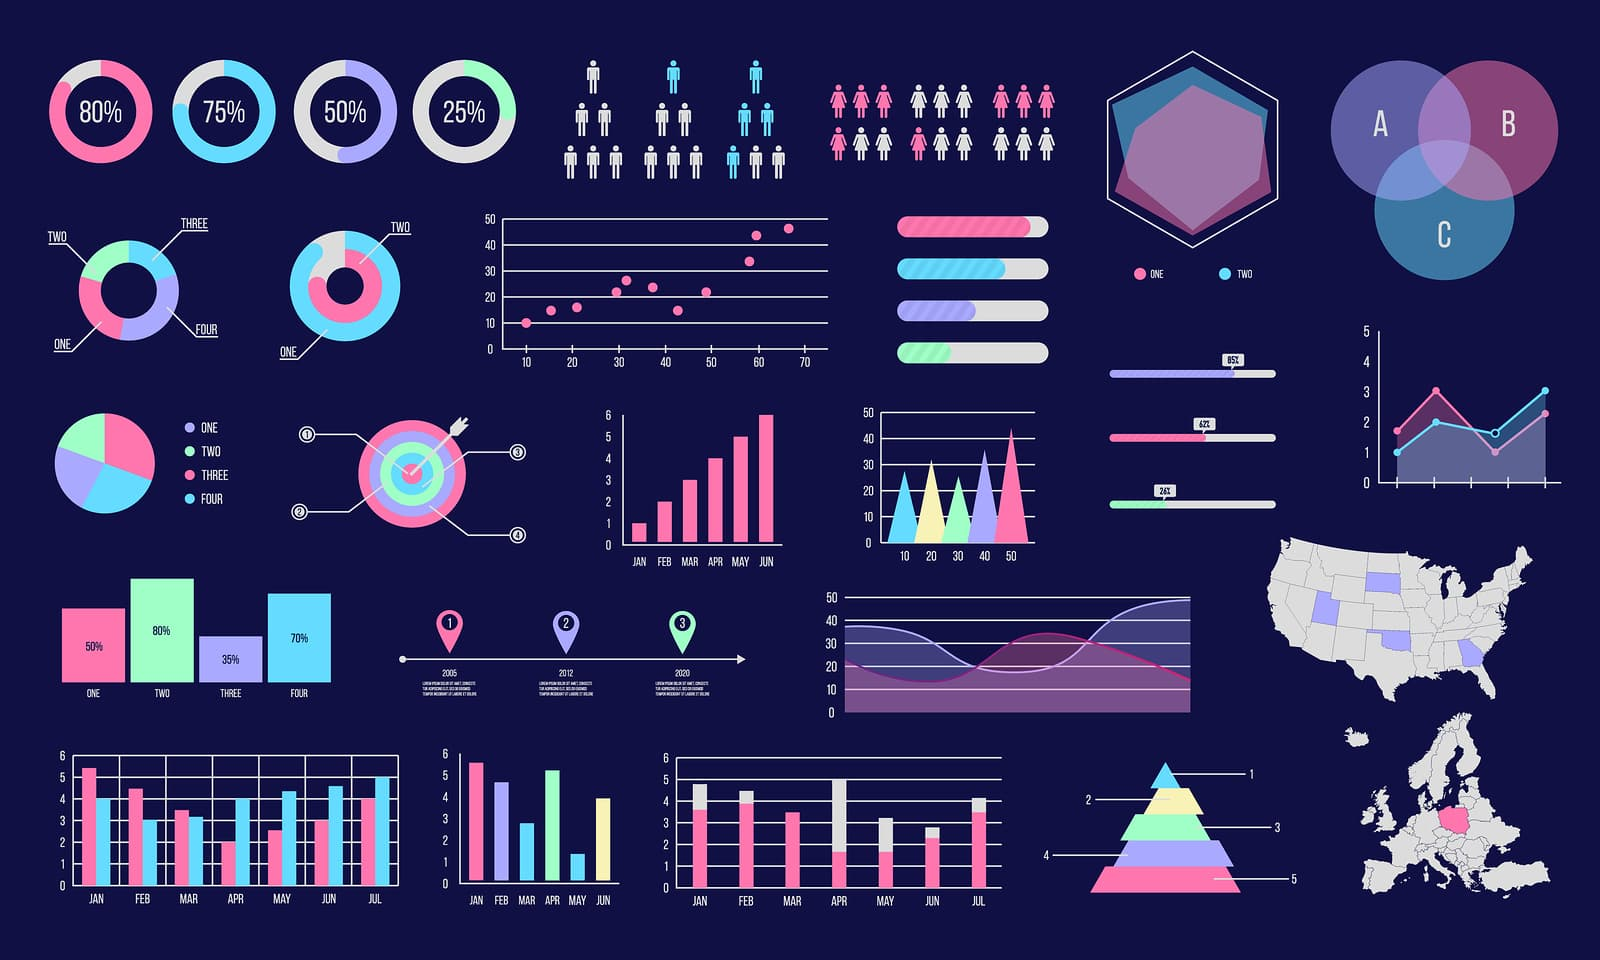
Data visualization (DataViz) has gained its popularity. During the current global health crisis, data visualization tools have provided visuals of the new infections, fatalities, recoveries, and more. Besides, DataViz enables users to visualize large amounts of complex data, helping businesses in their decision-making and forecast future trends and patterns.
Data Visualization Through AR/VR
Dataviz in Augmented Reality (AR) and Virtual Reality (VR) might be the next major use case, with salient examples of 3D data visualizations, which supports building models, developing games, and virtual events, indicating big changes in the way we interact with data.
Experts anticipate the market size of augmented VR to be worth around US$209bn globally by 2022. It’s worth pointing out that VR enables us to touch information as if it’s real, resulting in accurate data analysis and faster decisions.
Data Storytelling Here to Stay
For long, publishers have recognized the power of data in storytelling. Two major US publications will testify to that. Their journalistic stories, enhanced by data visualizations, went viral and are the most-viewed and most-popular articles on their websites. One is an illustration of how social distancing helps reduce the spreading of infection. The other visualizes the fatality rate in Latin America, North America, Europe, Asia, and other geographical regions.
A Wharton School of Business study finds that effective use of data visualizations shortens meetings by 24% (Photo: Nordic Coder)
Smart Devices
Smart traffic systems, for example, help foresee traffic bottlenecks a few hours before the commute. Also, they can forecast public transport shortages while guiding commuters to handle possible congestions in their routes. AR in autonomous vehicles would improve safety by overlaying key information for the driver, making them aware of possible risks in their routes, providing emergency alerts. With the rising users’ expectation of the effectiveness of data, DataViz will help detect abnormalities, trends, and spikes in data.
Real-Time Visualization
Visualizing data in real-time accelerates the entire decision-making process for both authorities and enterprises. The Johns Hopkins University dashboard, which has visualized the spread of the ongoing pandemic across the world, is a popular example of the impact of real-time visualization. Accessing real-time data has helped officials identify the emerging hotspots and utilize the available resources to reduce the spread of the virus.
Data visualization helps organize data into a comprehensible format and convey it as a story that highlights essential information. With the volume of data increasing rapidly, visualizations are essential to understanding the trillions of rows of data being generated daily.
Source: DZone
About us: TMA Solutions was established in 1997 to provide quality software outsourcing services to leading companies worldwide. We are one of the largest software outsourcing companies in Vietnam with 2,500 engineers.
Visit us at https://www.tmasolutions.com/
Data visualization (DataViz) has gained its popularity. During the current global health crisis, data visualization tools have provided visuals of the new infections, fatalities, recoveries, and more. Besides, DataViz enables users to visualize large amounts of complex data, helping businesses in their decision-making and forecast future trends and patterns.
Data Visualization Through AR/VR
Dataviz in Augmented Reality (AR) and Virtual Reality (VR) might be the next major use case, with salient examples of 3D data visualizations, which supports building models, developing games, and virtual events, indicating big changes in the way we interact with data.
Experts anticipate the market size of augmented VR to be worth around US$209bn globally by 2022. It’s worth pointing out that VR enables us to touch information as if it’s real, resulting in accurate data analysis and faster decisions.
Data Storytelling Here to Stay
For long, publishers have recognized the power of data in storytelling. Two major US publications will testify to that. Their journalistic stories, enhanced by data visualizations, went viral and are the most-viewed and most-popular articles on their websites. One is an illustration of how social distancing helps reduce the spreading of infection. The other visualizes the fatality rate in Latin America, North America, Europe, Asia, and other geographical regions.
A Wharton School of Business study finds that effective use of data visualizations shortens meetings by 24% (Photo: Nordic Coder)
Smart traffic systems, for example, help foresee traffic bottlenecks a few hours before the commute. Also, they can forecast public transport shortages while guiding commuters to handle possible congestions in their routes. AR in autonomous vehicles would improve safety by overlaying key information for the driver, making them aware of possible risks in their routes, providing emergency alerts. With the rising users’ expectation of the effectiveness of data, DataViz will help detect abnormalities, trends, and spikes in data.
Real-Time Visualization
Visualizing data in real-time accelerates the entire decision-making process for both authorities and enterprises. The Johns Hopkins University dashboard, which has visualized the spread of the ongoing pandemic across the world, is a popular example of the impact of real-time visualization. Accessing real-time data has helped officials identify the emerging hotspots and utilize the available resources to reduce the spread of the virus.
Data visualization helps organize data into a comprehensible format and convey it as a story that highlights essential information. With the volume of data increasing rapidly, visualizations are essential to understanding the trillions of rows of data being generated daily.
Source: DZone
About us: TMA Solutions was established in 1997 to provide quality software outsourcing services to leading companies worldwide. We are one of the largest software outsourcing companies in Vietnam with 2,500 engineers.
Visit us at https://www.tmasolutions.com/